According to data from SoSoValue, all four major U.S. spot ETF groups simultaneously recorded net inflows during the September 28 session (Eastern Time), totaling approximately $65 million. Of that, Bitcoin attracted $31.07 million, its lowest daily total of the month, yet extended its positive flow streak to an eighth consecutive day. Ethereum also maintained its capital inflow momentum for a seventh straight day, bringing in an additional $17.10 million.
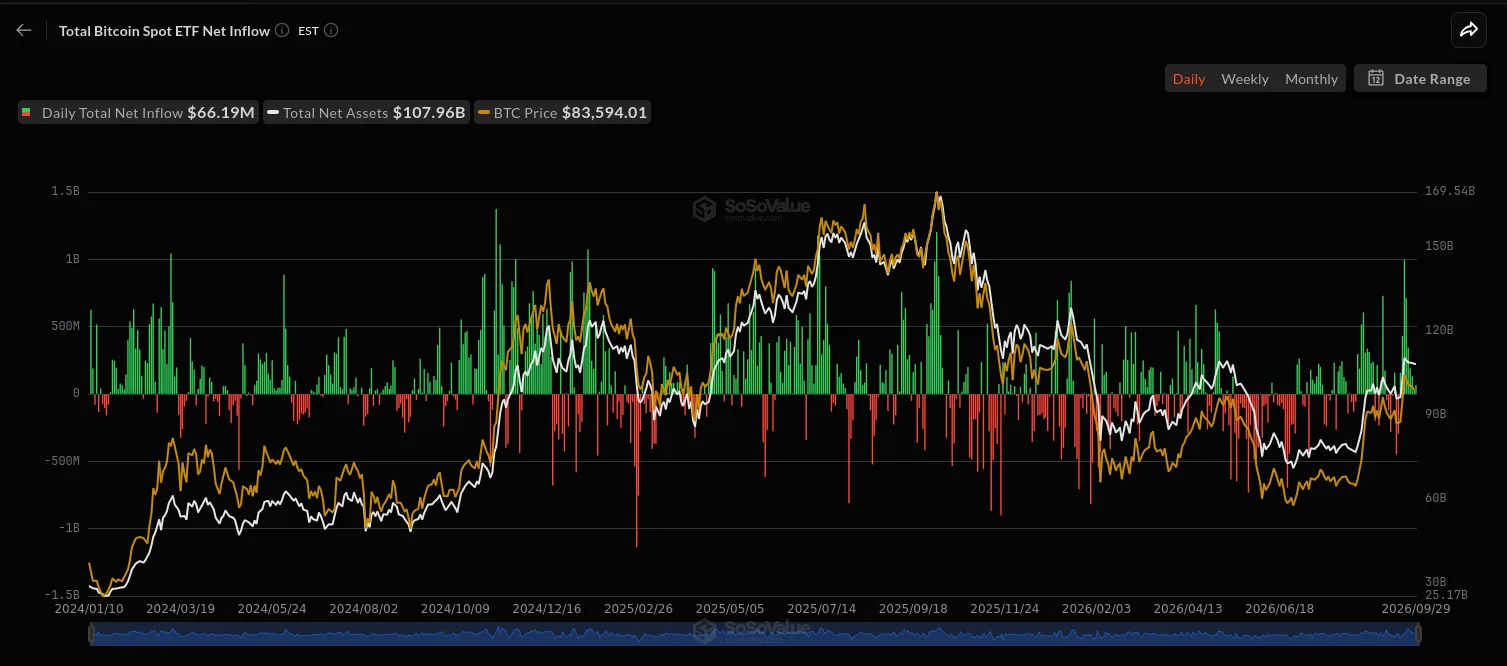
While $31.07 million might seem impressive for a standard trading session, the figure is actually quite modest in a broader context. For instance, in the week ending around September 25, Bitcoin ETFs drew a 2026 record of roughly $2.39 billion, turning the group’s year-to-date cumulative net flows from negative to positive. Also on September 25, Solana set a single-day inflow record of $86.7 million.
Cumulative Picture Still Favors Bitcoin
In terms of cumulative accumulation since inception, the gap among spot ETFs is stark. Leading the market is spot Bitcoin ETFs, having attracted $57.58 billion in cumulative inflows since January 2024, pushing total net assets to $107.82 billion. According to a report from Crypto Briefing, the amount of Bitcoin held in these managed ETFs currently accounts for about 6.42% of total market capitalization. Ethereum holds second place with $13.96 billion in cumulative inflows against an asset base of $17.69 billion.
Meanwhile, the two newest entrants to the ETF market have their own growth drivers:
- XRP: Following the resolution of legal hurdles with the SEC, XRP ETFs quickly brought in $1.79 billion in cumulative inflows since late 2025.
- Solana: Following closely behind with $1.62 billion, Solana possesses a unique competitive edge that neither Bitcoin nor Ethereum offers: certain Solana ETF products allow direct pass-through of staking rewards to investors, turning a passive investment into an actively yield-generating asset.
Price Story and Flow Story Diverge
Price action shows Bitcoin delivering a major surprise this quarter, surging over 40% and significantly outperforming gold, the S&P 500, and other major financial assets. Even as long-term yields hit multi-year highs not seen since 2007—causing gold to drop nearly 4% on Monday—BTC maintained strong resilience: after bottoming around $82,500, price quickly recovered, shedding only 1%. Over the same period since September 9, the DXY index rose 2.7% (from 98.78 to nearly 101.50).
Despite U.S. consumer confidence dropping to a record low in over a decade (according to CoinDesk data), Bitcoin stood firm against macroeconomic headwinds. This resilience has fueled attention surrounding a potential W-shaped double bottom pattern.
However, CoinDesk noted that this assessment appeared in its Daybook analysis newsletter rather than official news reporting. While Jurrien Timmer, Director of Global Macro at Fidelity Investments, suggested that a breakout from a double bottom pattern would reinforce the bullish trend and open up prospects for the $100,000 mark, he also cautioned that technical patterns offer no guarantees and breakouts can easily fail. This divergence is also evident in the options market: $90,000 call positions dominate with $2.45 billion in open interest (OI), whereas $100,000 calls stand at just $1.79 billion and could swiftly reverse.
The key issue lies in the disconnect between market sentiment and actual capital flows. While price movement reflects a repricing of long-term expectations, daily structural inflows remain modest at a few tens of millions of dollars—far below the weekly scale of $2.39 billion. The decisive factor in the upcoming phase is not simply whether Bitcoin continues to rise, but whether ETF inflows will catch up with price momentum heading into October, or if the market will remain primarily dependent on expectations rather than actual capital.